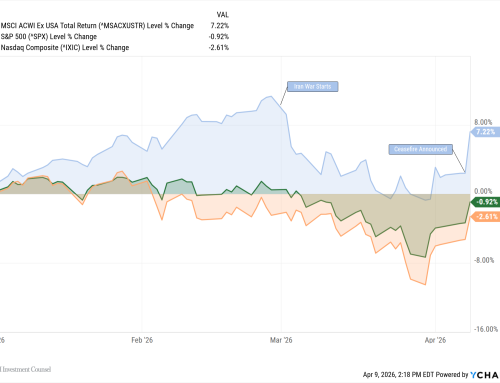
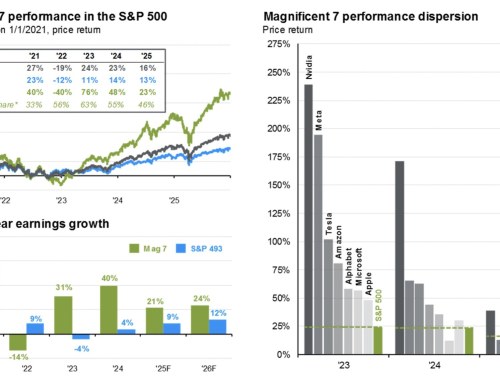
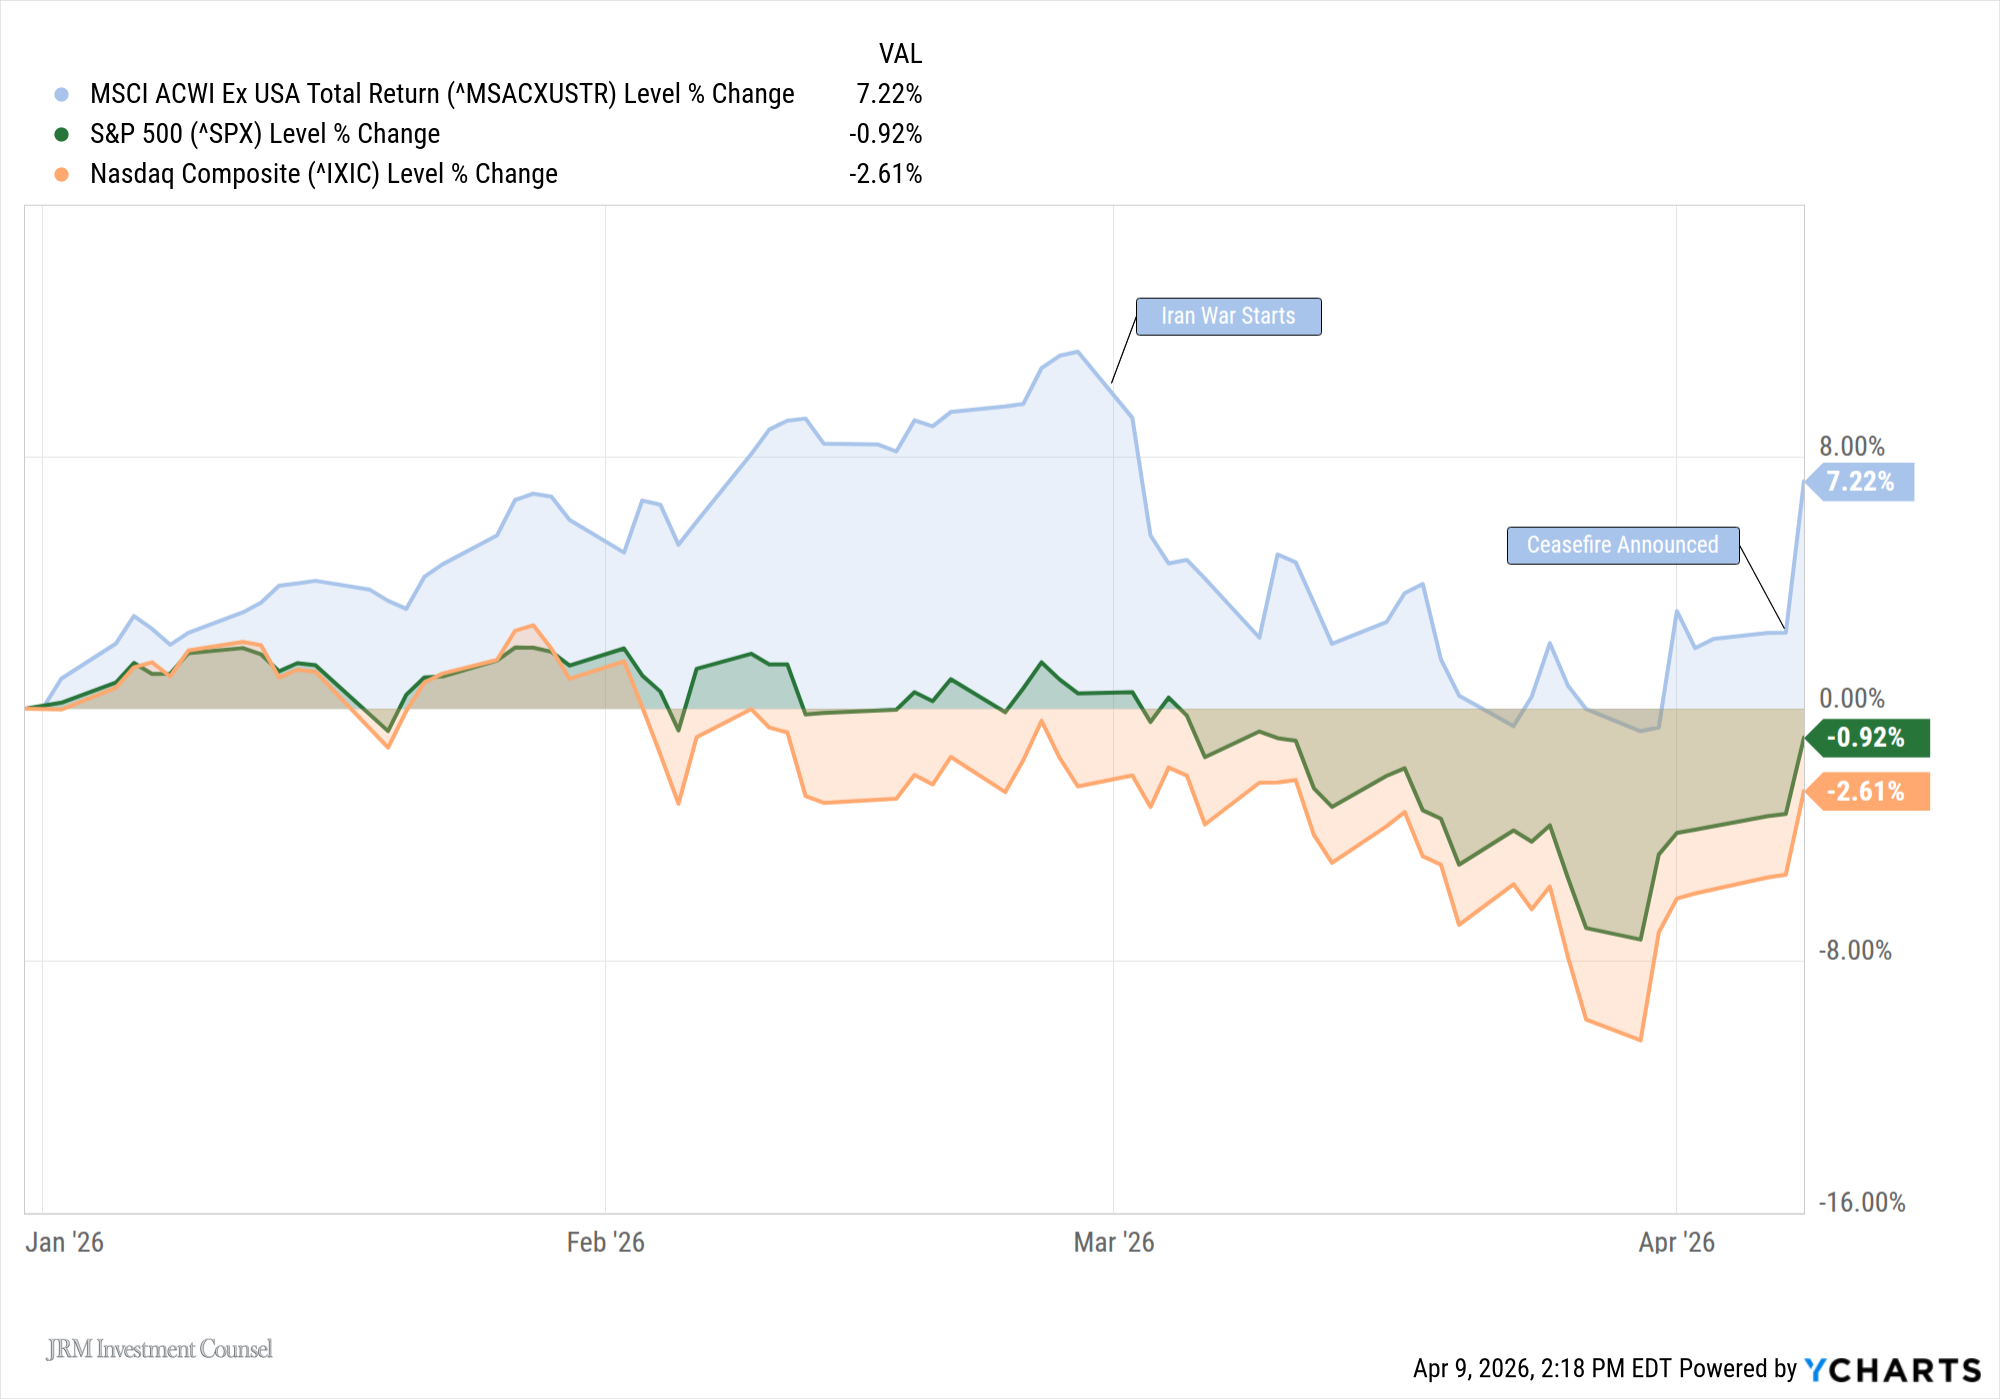
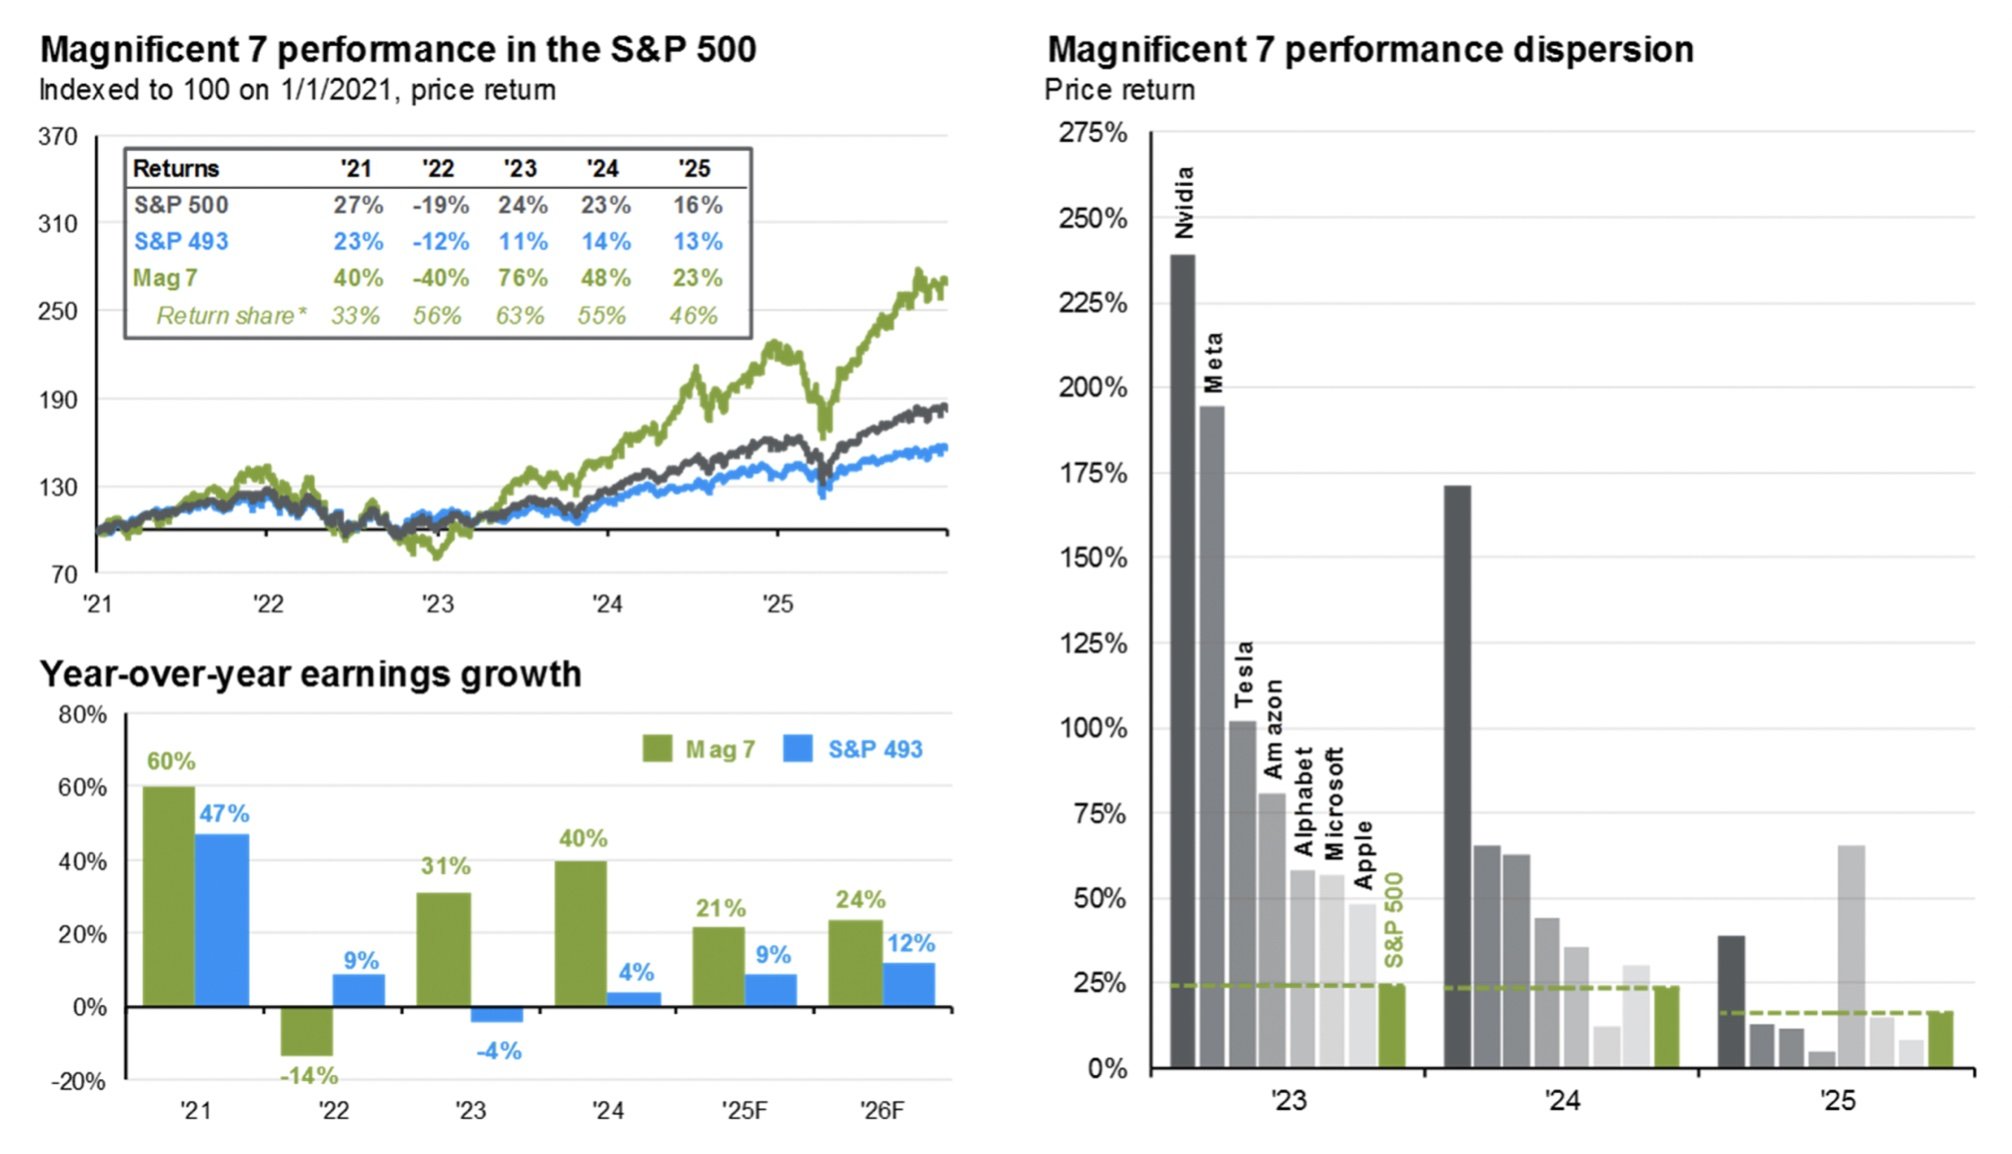
Following a volatile first quarter, domestic equity markets staged a significant rebound in Q2. The S&P 500 rose 10.9% during the quarter, led by a resurgence in large-cap technology stocks while the Nasdaq advanced more than 30% from its April low.
International equities also delivered positive returns, with developed markets continuing to outpace the U.S. year to date. The MSCI EAFE Index (representing developed international markets) returned 11.8%, buoyed by fiscal stimulus in Europe and policy support in Japan. Emerging markets returns were slightly higher, 12%, with gains in tech-heavy markets like Taiwan and Korea offset by ongoing weakness in China.
Fixed income delivered modest returns. The Bloomberg Barclays U.S. Aggregate Bond Index gained 1.2% in Q2. After an initial flight to safety in early April, Treasury yields climbed before retreating in June, leaving the 10-year Treasury at 4.3% with a slightly steeper yet still inverted curve. Preferred stocks, investment-grade corporates, and municipal bonds performed well as credit spreads tightened and demand for high-quality income persisted. For the first half of the year, core bond indices produced low- to mid-single-digit returns, helping stabilize portfolios amid equity market swings.
Currency effects added to the story. The U.S. dollar has fallen 10% year to date—its weakest start since 2005—boosting foreign equity returns for U.S.-based investors. A softer dollar benefits U.S. exports and overseas earnings but also makes imports more expensive and reduces the value of foreign companies’ U.S. revenues when translated back home.

Source: Bloomberg, FactSet, J.P. Morgan Asset Management; Guide to the Markets – U.S. Data are as of July 14, 2025.
The U.S. remains a significant net importer. Prolonged dollar weakness raises import costs, lifting expenses for consumers and businesses while increasing currency-hedging costs for foreign investors. With overseas investors holding roughly 20% of U.S. equities, 30% of corporate debt, and 25% of federal debt, this dynamic could make U.S. assets less attractive on a net basis and prompt some capital to shift abroad.
While our capital markets remain the most robust and transparent in the world, history shows that sustained dollar weakness can erode purchasing power, disrupt trade flows, and weigh on investor sentiment.
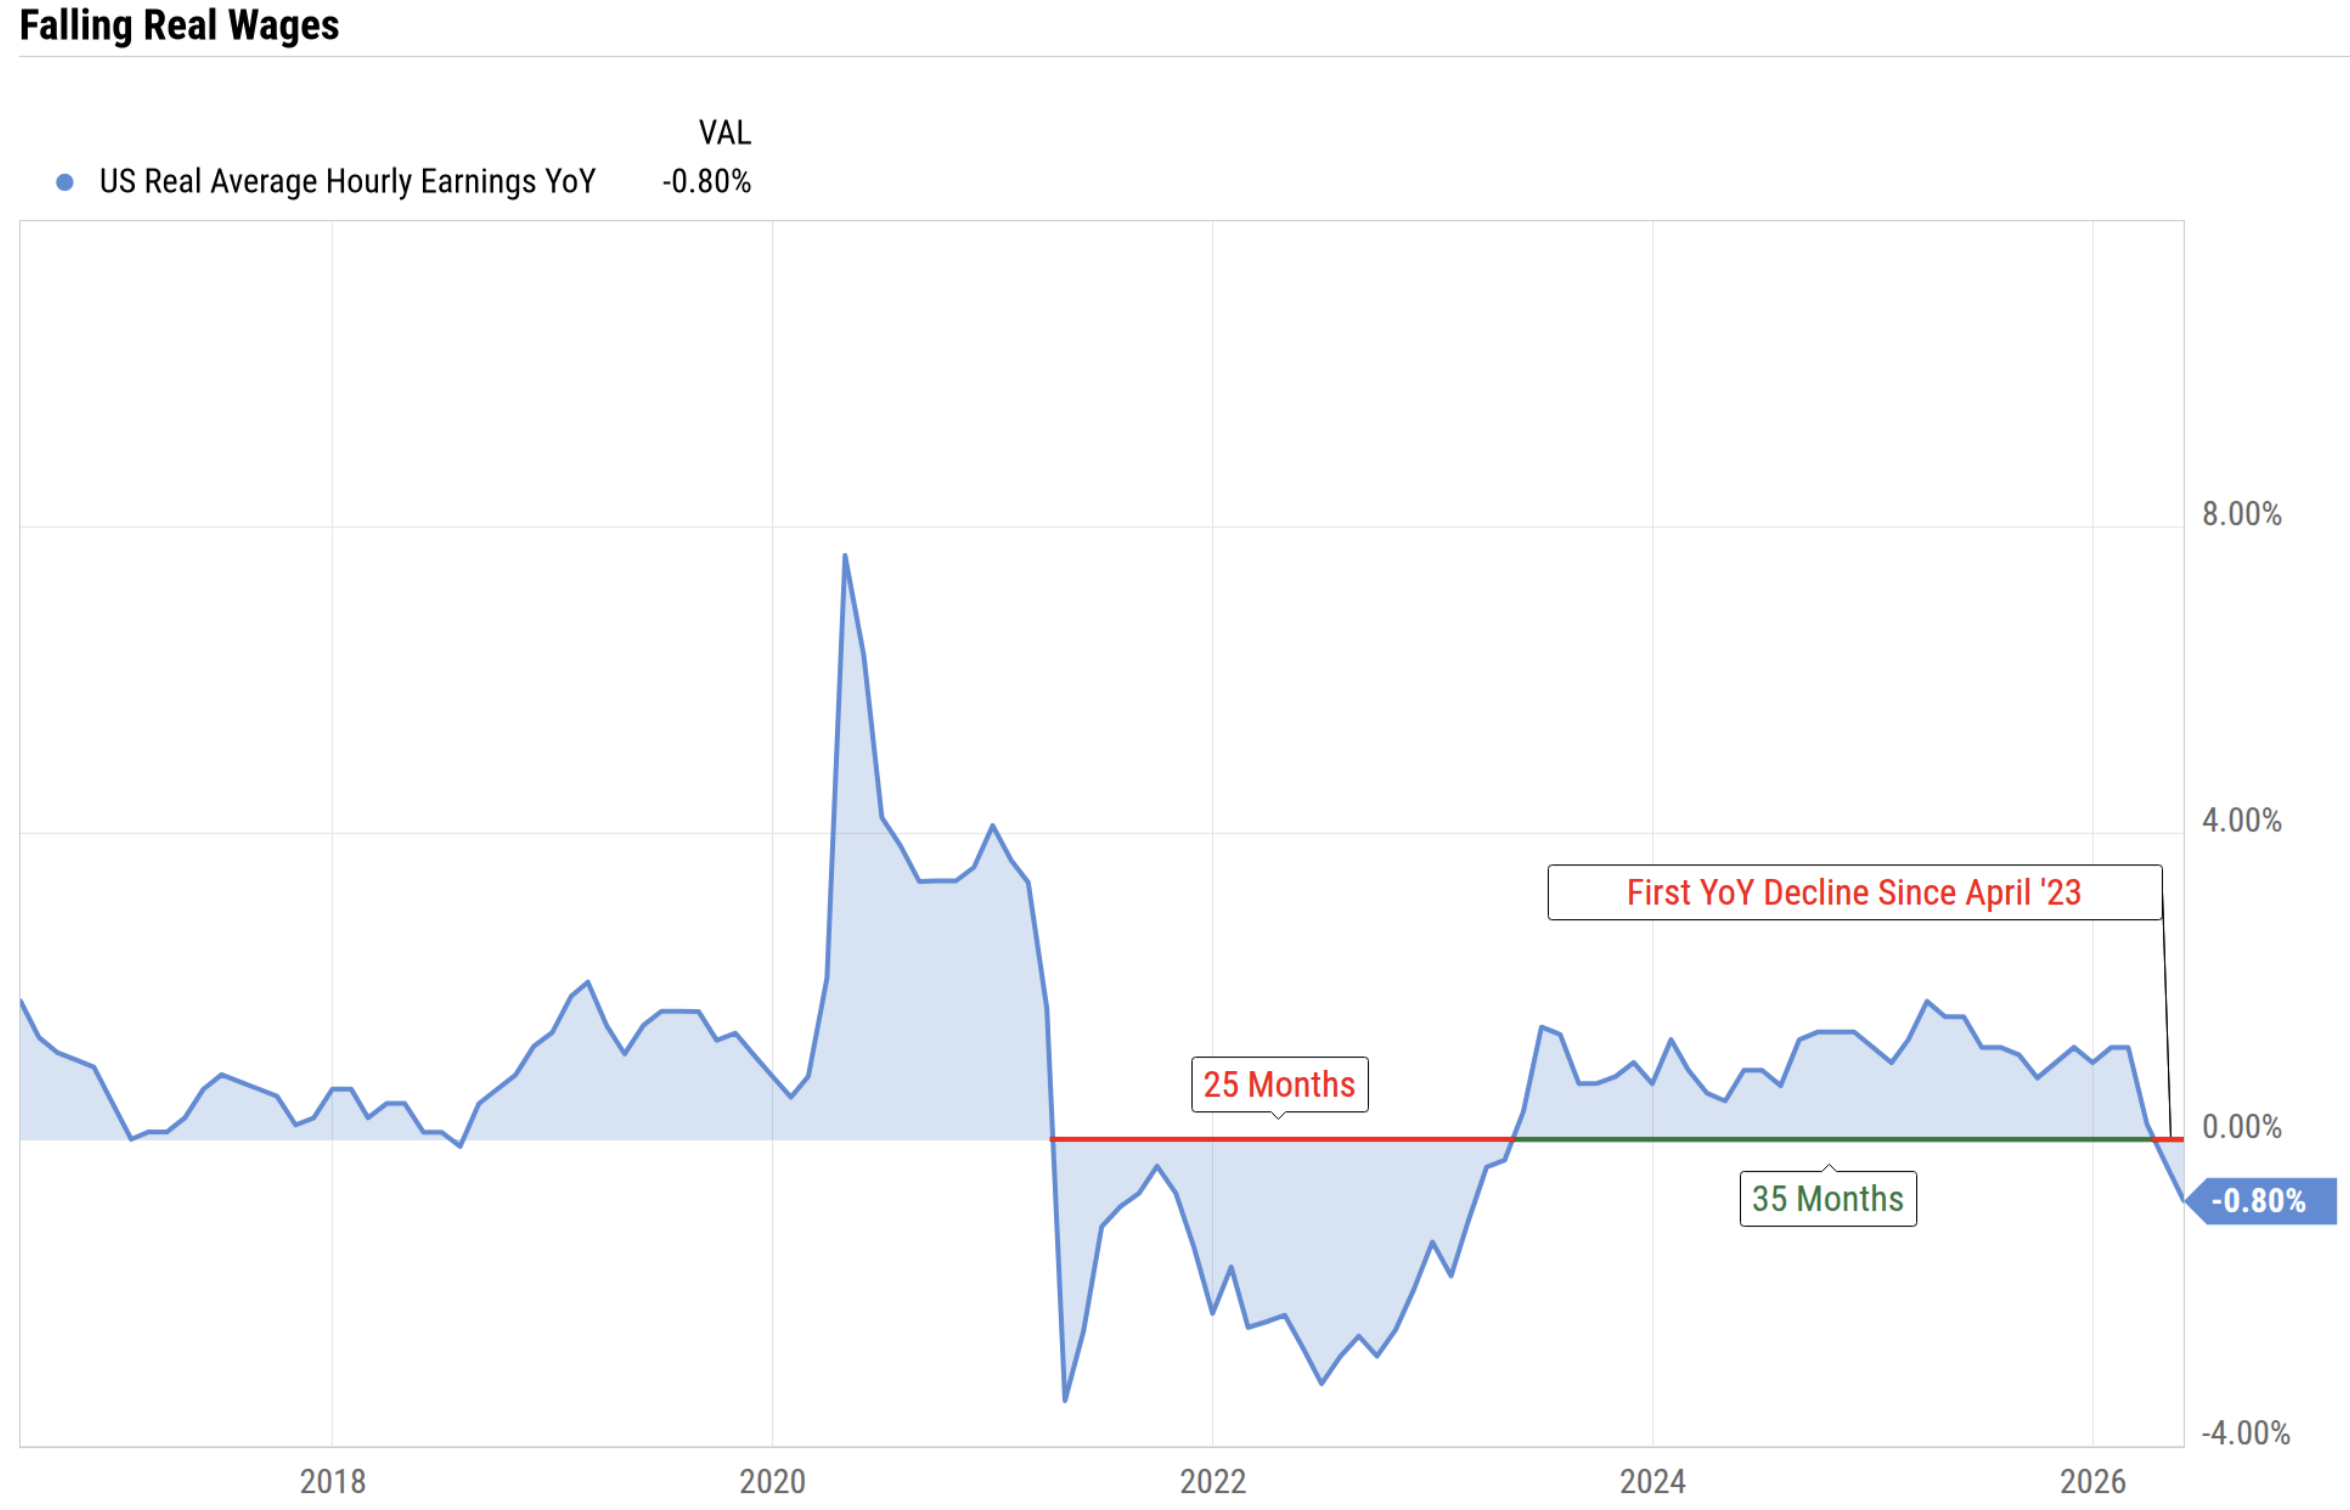
Economic data released during the quarter showed continued resilience but also early signs of slowing momentum. The U.S. added 139,000 jobs in May, bringing the three-month average to 149,000—below 2023’s pace but still healthy relative to historical norms. The unemployment rate held steady at 4.2%, while wage growth moderated slightly to 3.9% year-over-year. However, continuing unemployment claims reached their highest level in more than three years, and consumer confidence surveys showed fewer Americans believe jobs are readily available.
Household finances are showing increasing strain, as illustrated in the chart below highlighting the share of households with balances over 90 days delinquent across various types of debt.

Source: Federal Reserve Bank of New York; Macrobond; Apollo Chief Economist.
Inflation-adjusted consumer spending fell 0.3% in May. Delinquencies on credit cards and auto loans climbed to their highest since the financial crisis, signaling mounting debt stress. Mortgage and home-equity debt remain manageable, but only about 65% of American households own their homes. Student loan delinquencies have surged following the end of pandemic-era forbearance under the CARES Act—nearly 25% of the 45 million federal borrowers are now delinquent or in default. With consumption accounting for ~70% of U.S. GDP, these trends point to weakening purchasing power for many households.
Inflation ticked higher into June. Headline CPI rose to 2.7% year-over-year (up from 2.4% in May), while core CPI edged to 2.9%. Monthly prices rose 0.3% overall (core +0.2%), driven partly by tariff-sensitive categories such as furnishings, toys, and electronics. Tariff collections surged to $27 billion in June—nearly four times last year’s level—implying an effective tariff rate near 8.2% and likely adding to consumer costs in the second half of the year.
Trade tensions dominated headlines early in the quarter, discussed extensively in our last letter, but briefly eased after mid-April. The U.S. and United Kingdom reached a bilateral agreement lowering tariffs on key sectors such as aerospace and automotive exports, while the U.S. and China agreed to a temporary truce that rolled back some of April’s steepest duties.
That optimism again faded in July when President Trump announced plans to sharply raise tariffs on imports from Canada, the European Union, and Mexico—potentially as high as 35% by August 1 if no new agreements are reached. Fourteen additional countries, including Japan and South Korea, were also warned of reciprocal tariffs. Affected partners condemned the moves but remain at the negotiating table, leaving markets braced for renewed volatility as trade talks continue under a more confrontational tone.
The long-term implications remain uncertain. While the effective tariff rate was reduced from April highs of 30% to 15% in June, it remains the highest since the Great Depression—and new increases are set for August. Higher duties are likely to continue pressuring profit margins, consumer prices, and employment as they ripple through global supply chains.

Source: Goldman Sachs Investment Research, United States International Trade Commission, J.P. Morgan Asset Management. For illustrative purposes only. The estimated weighted average U.S. tariff rate includes the latest tariff announcements. Estimates about which goods are USMCA compliant come from Goldman Sachs Investment Research. Imports for consumption: goods brought into a country for direct use or sale in the domestic market. The estimate does not consider non-tariff barriers, such as value-added taxes. *Figures are based on 2024 import levels and assume no change in demand due to tariff increases. Forecasts, projections and other forward-looking statements are based upon current beliefs and expectations. They are for illustrative purposes only and serve as an indication of what may occur. Given the inherent uncertainties and risks associated with forecasts, projections or other forward-looking statements, actual events, results or performance may differ materially from those reflected or contemplated. Guide to the Markets – U.S. Data are as of July 14, 2025.
The Federal Reserve held interest rates steady at 4.25–4.50% during the quarter. Policymakers acknowledged that tariffs could add to near-term inflation but signaled patience, waiting for more clarity on how trade policy, immigration enforcement, and fiscal spending will affect the economy.
If growth slows while inflation remains elevated, the Fed could face a stagflationary dilemma: support growth by cutting rates and risk fueling inflation, or keep rates elevated to control prices at the expense of employment. Futures markets currently price in one to two rate cuts by year-end, though the timing and magnitude (or whether any occur at all) will depend on the data.
Despite a strong Q2 rally in global equities, uncertainty remains elevated. Structural shifts in trade and immigration policy, elevated inflation, restrictive interest rates, and a decelerating U.S. economy have complicated the outlook. These factors reinforce the importance of preparing for a wide range of outcomes.
The S&P 500 index is trading around 22x forward earnings, and investment-grade bonds yield 4–5%, leaving the equity risk premium historically low. To sustain current valuations, corporate earnings must not only remain stable but accelerate meaningfully in 2026—despite rising costs, slowing growth, and trade headwinds. Tariffs and a weaker dollar could pressure margins, especially for firms reliant on imports.
Businesses may absorb these costs, reduce expenses elsewhere, or pass them on to consumers—each with implications for profitability and demand. Sectors with global supply chains or limited pricing power may face the most acute pressure. As a result, maintaining elevated earnings expectations will likely require a combination of cost efficiency, pricing power, and a resilient consumer—all challenges in a slowing economy.
In contrast, developed international and emerging market equities trade at more modest 15x and 13x forward earnings, respectively. While there are unique risks to investing abroad, more reasonable valuations offer a margin of safety and the potential for higher forward expected returns. Also compelling are preferred stock yields in the 6–7%+ range and Nebraska municipal bond yields in the 4–5%+ range (7–9%+ tax-equivalent, assuming the highest marginal tax bracket).
Finally, we want to comment on Warren Buffett’s announcement that he will step down as CEO of Berkshire Hathaway at the end of 2025. Vice Chairman Greg Abel—long expected to succeed him—will assume the CEO role in January 2026. Buffett will remain Chairman and continue advising Abel and the broader management team.
We have strong conviction in Berkshire’s succession plan and its ability to thrive well beyond Buffett’s tenure. The company’s decentralized structure and experienced leadership have been built with this transition in mind. As Buffett stated, he has “no intention—zero—of selling one share of Berkshire Hathaway,” and believes the company will perform even better under Abel’s leadership.
Berkshire is built for the long haul, and we continue to view it as a core holding in client portfolios. While the stock declined about 9% in Q2 after reaching an all-time high in early spring, it remains up roughly 5% year to date—closely tracking the S&P 500’s 6% gain. With a fortress balance sheet, diversified holdings, and disciplined capital allocation, Berkshire has historically outperformed in turbulent markets and capitalized on periods of dislocation. With Abel at the helm and Buffett still involved, we remain confident in the company’s long-term prospects.
We are investing in a constantly evolving and uncertain world—an environment that underscores the importance of long-term planning, thoughtful diversification, and disciplined asset allocation. This remains the most reliable path to achieving favorable investment outcomes over time.
As Buffett reminds us, “The rearview mirror is always clearer than the windshield.”
In today’s environment, patience and discipline remain our strongest advantages. Please don’t hesitate to reach out if you’d like to review your portfolio or financial plan.
Respectfully,
The JRM Investment Counsel Team
Jack, Phil and Lauren