At the halfway point of 2024, our views on the current state of capital markets have not materially changed. Markets continue to rally forward, valuations are high, inflation remains above the Fed’s target (but showing signs of improvement), and the economy continues to exceed expectations despite decade-high interest rates (with some early indicators of weakening).
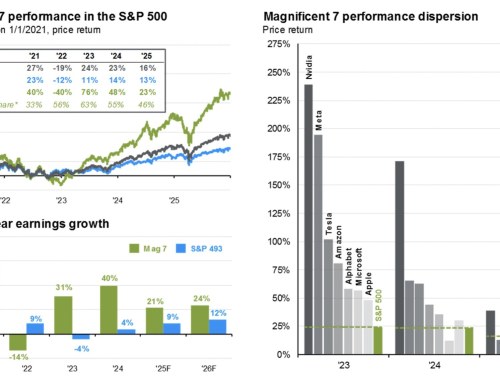
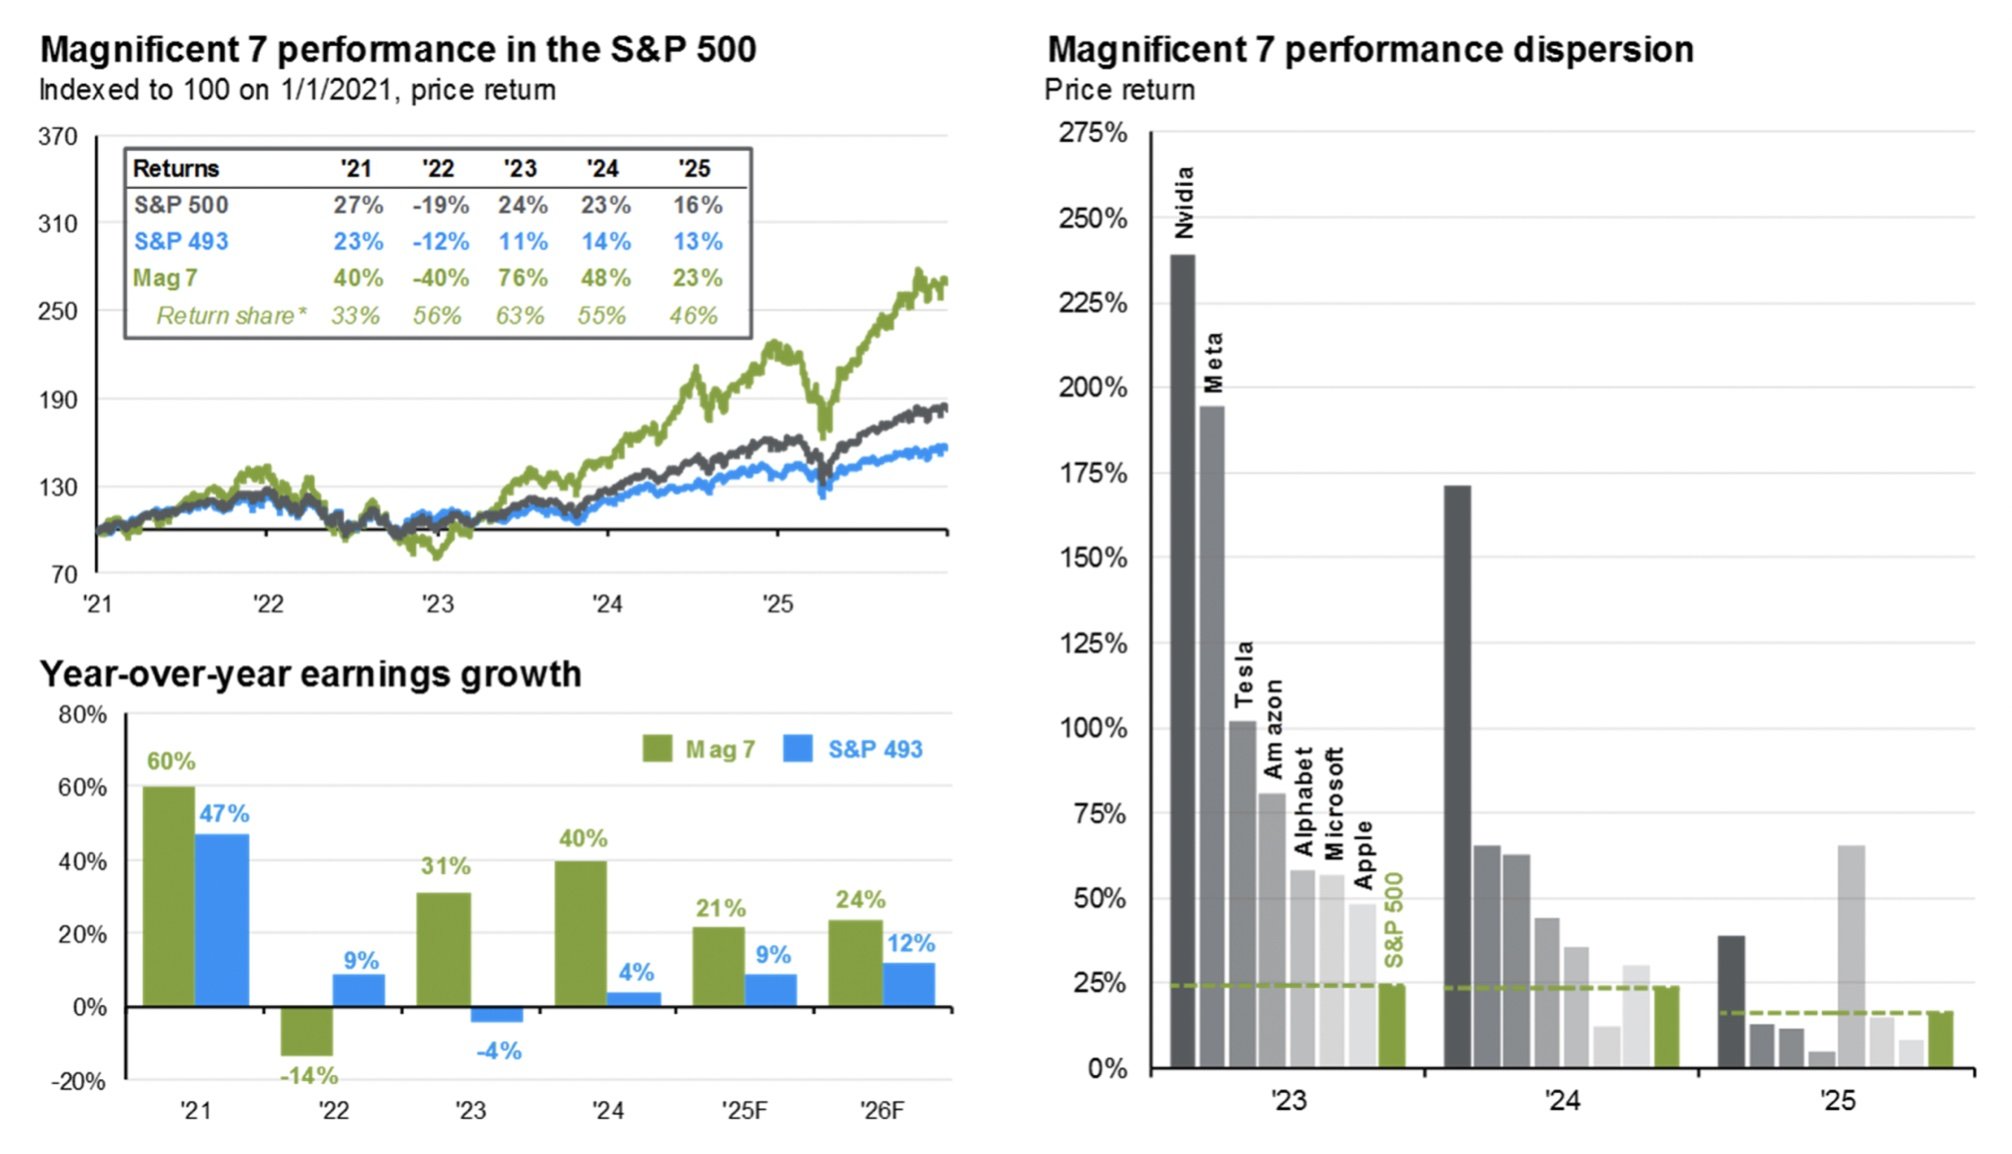
The S&P 500 was up 4.3% for the quarter, yet the average S&P 500 stock was down 2.6%. This index return was driven by a handful of mega, tech-heavy companies fueled by generative AI momentum. Abroad, developed markets were relatively flat for the quarter, but emerging markets outperformed the US, returning 5.0%.
The chart below shows the cyclical nature of the S&P 500 over the last 20 years. In this example we are comparing the relative performance of the market-cap and equal-weight index for one-year rolling period returns. As implied, the equal-weight S&P 500 index values all 500 companies equally within the index allocation. The market cap-weighted S&P 500 index, commonly quoted on CNBC and in other publications, values each company by its relative market value. Equal-weight indexes have a higher allocation to smaller companies and smaller allocation to larger companies, whereas the market-cap index is currently very concentrated in the largest US companies, such as Microsoft, NVIDIA, and Apple, which represent 20% of the index. The performance difference as of quarter-end was -12.7% over the past year.

Market-cap S&P 500 returns recently surpassed the relative outperformance seen during the 2020 pandemic lockdowns. While maintaining an allocation to smaller companies has historically benefited long-term results, it has not been advantageous in the short term.
This asset class has faced secular headwinds and a shift in investor sentiment or catalyst may be necessary for this trend to change. Stocks with relatively small market caps tend to outperform during economic recoveries, but late in a market cycle, investors gravitate towards the perceived safety of larger companies.
Valuations for small cap stocks are attractive, and we expect relative performance to eventually improve. Mega-cap stocks, in contrast, are valued well above their historical averages.
NVIDIA, for example, represented over 7% of the market-cap weight S&P 500 index at quarter end. The stock hit a new high June 18 at $136 on a split adjusted basis. Despite entering correction territory shortly thereafter, the stock is still up 200% over the past twelve months and 3,000% (not a typo) over the past five years. Today NVIDIA is one of three S&P 500 companies with a $3 trillion+ valuation.
Aided by a shortage of manufacturing capacity for AI semiconductor chips, NVIDIA’s revenues and income increased 370% and 790%, respectively, during the last year and its 65% profit margin is the highest among comparable S&P 500 companies.
The company’s revenue streams are mostly non-recurring and over 60% comes from its top 10 customers (other large AI players including Microsoft, Meta, Amazon & Google). With such explosive growth in concentrated non-recurring revenue, forward earnings expectations and intrinsic value analysis are exceptionally difficult to estimate. Even so, at today’s price of ~$130, NVIDIA is valued at 45x next year’s median analysts earnings estimates. To quote acclaimed author Morgan Housel:
“Every market valuation is today’s earnings multiplied by a story about tomorrow, and the stories can change much faster than the earnings.”
NVIDIA’s story has created significant stock price momentum. Their ability to replicate past results will rely on its ability to continue to innovate, grow revenue, maintain profit margins… and avoid being supplanted by its customers or competitors.
The Bloomberg US Aggregate Bond Index produced a marginal 0.07% Q2 return. Yields rose early in the quarter, but then retreated, with the 10-year at 4.2% as of July 11th. The following chart compares the current yield curve to the average yields from 2000-2009 (pre-Great Financial Crisis) and 2009-2019 (post-Great Financial Crisis).

An inverted yield curve, where short-term Treasury yields exceed long-term, traditionally signals an economic downturn on the horizon. June marks 23 consecutive months of inversion without a recession, the longest streak on record. While this may seem like the new norm, it’s not; usually, the yield curve slopes upward as longer-term bonds offer higher yields to compensate for increased risk. Our view is this economic cycle is not different, just delayed.
When economic conditions normalize and become more balanced, the curve will return to this upward slope, similar to the pre-Great Financial Crisis. Recently, the Fed reduced the number of expected rate cuts for 2024, likely keeping the curve inverted until significant reductions occur.
Now onto the fun part – it’s an election year. The outcome in November is uncertain, and with the presidential election season in full swing, election-related noise is unavoidable. This can be distracting for investors, but it’s important to note that markets typically focus more on the economic backdrop than on political agendas or election results.
The stock market has historically performed well across all variations of political party control, but generally performs best during divided government. The following chart shows the average annual returns under different government scenarios, including control of both the White House and Congress.

Despite positive results across all election outcomes, this reveals very little about the reasons behind market movements. Factors such as monetary policy, economic conditions, labor markets, corporate profits, and valuations are more predictive of future returns. When it comes to market environments, the economic context is ultimately more relevant than the political context.
To demonstrate the importance of remaining invested, we’ve included a study from Bespoke Investment Group. The study back tested how much $1,000 invested in the S&P 500 would be worth today if you stayed in the market only when your favored political party held the presidency or remained invested the entire time, looking back 70 years.

A portfolio invested only when a Democratic president was in office would have grown from $1,000 to $61,800, while investing only during a Republican president’s tenure would be worth $27,400. If you remained invested regardless of who held office, that $1,000 would be worth $1,690,000 today. The opportunity cost of moving to cash and not staying in the market continuously is enormous.
Politics are important and can be polarizing for a variety of reasons, but they should not influence asset allocation decisions. Investment portfolios should be designed based on your long-term financial goals, objectives and risk tolerance.
We are grateful for your trust and confidence. Please let us know if you have questions, would like to discuss your financial plan or review your investment portfolio.
Respectfully,
The JRM Investment Counsel Team
Jack, Phil and Lauren